Foundation guide · Space. Space telescopes collect electromagnetic radiation and turn it into measurements that scientists can analyze. Their value depends on the wavelengths they observe, their instruments and the questions they were designed to answer. A beautiful image is one possible output, but a telescope can also reveal brightness changes and spectra that carry information an ordinary photograph cannot.
This guide explains how space telescopes work, why different observatories complement one another and how to read their results. It is a guide to the measurement process, not a buying guide or a claim that one telescope is best for every astronomical problem.
Collecting light is the starting point
NASA’s telescope overview explains how lenses or mirrors collect light and bring it to an instrument. The size of the collecting surface affects how much light is gathered. However, the instrument, wavelength and observing conditions also shape the measurement.
For a fictional observing proposal, detecting a faint object and separating two nearby objects are different aims. More collected light helps with sensitivity; the ability to distinguish detail depends on angular resolution and other properties. A news report should say which capability improved instead of relying only on “more powerful.”
Magnification is not the whole story
Enlarging an image cannot create detail that was never measured. When a result involves a faint or distant target, ask about the observations, exposure and analysis rather than imagining a telescope simply zooming closer. This distinction is especially helpful when comparing a scientific image with a detailed artist’s impression.
Different wavelengths reveal different information
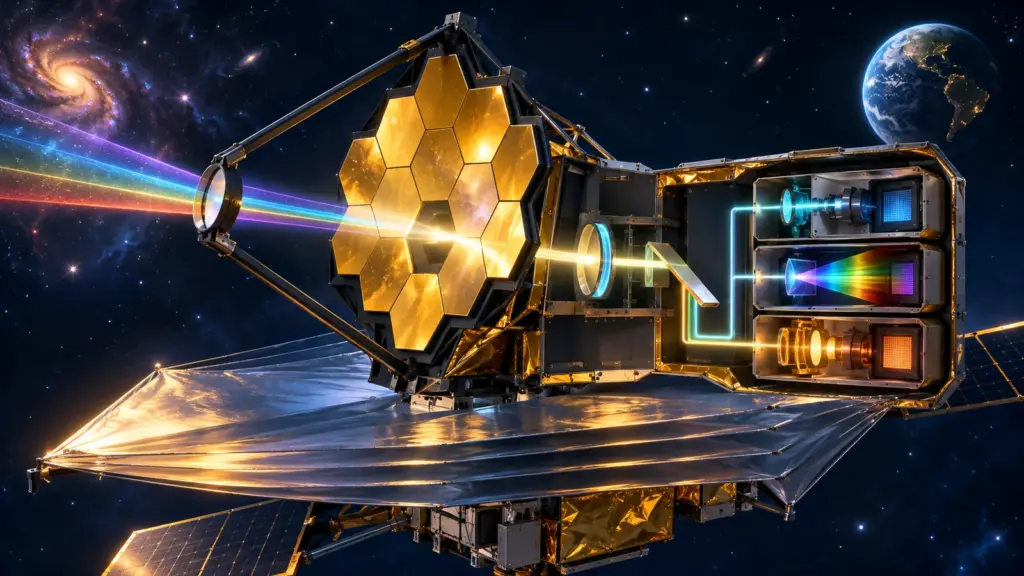
NASA’s Hubble wavelength guide explains that visible light is only part of the electromagnetic spectrum. Observatories can study ultraviolet, infrared and other bands, each suited to particular measurements. Hubble observes mainly visible light with ultraviolet and near-infrared capabilities; Webb emphasizes infrared observations.
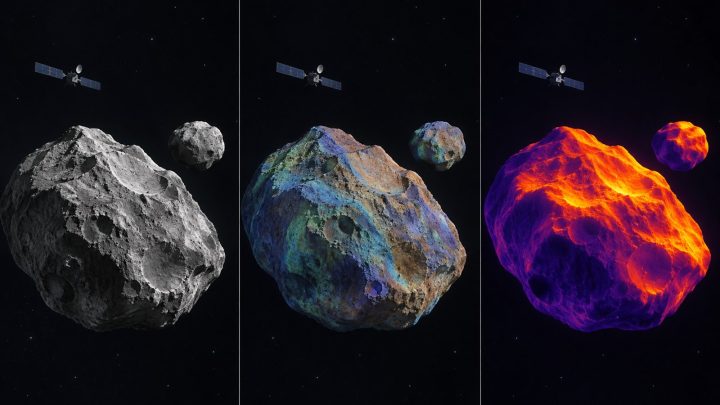
These are complementary views rather than successive versions of an identical camera. A question about a target’s properties may benefit from multiple wavelengths. When two images look different, first ask whether they show different radiation rather than assuming the object changed.
A combined image needs a combined explanation
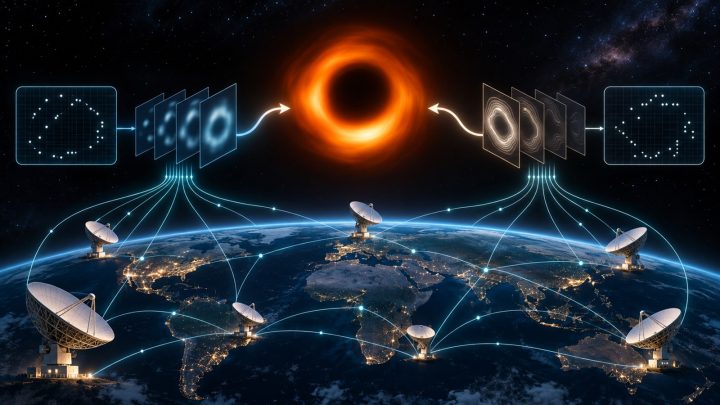
Suppose a graphic combines measurements from two instruments. Its caption should identify which instrument contributes which information. Do not treat every color as a substance unless the description explains that mapping. The data and the visual encoding are connected but distinct parts of the presentation.
Why put a telescope in space?
Earth’s atmosphere affects which radiation reaches the ground and can blur observations. Space observatories avoid many of those constraints. Ground-based astronomy remains essential, and ESO’s adaptive-optics explanation describes techniques that correct some atmospheric distortions using rapidly adjusted optical systems.
The appropriate comparison depends on the scientific task. Ask which wavelength, sensitivity, resolution and field of view the observation needs. A space telescope and a ground observatory can work together, including follow-up observations of the same target.
In a news story, “space-based” should explain an advantage relevant to the result. It is not a substitute for describing the instrument or the measurement.
Infrared observatories must manage their own heat
NASA’s explanation of Webb’s sunshield describes how the observatory is protected from external light and heat. Keeping the relevant instruments cold is part of measuring faint infrared signals. The thermal design is therefore connected to the science, rather than simply a spacecraft comfort system.
This creates a useful reading question: which engineering feature enables the particular observation? A headline about an instrument can become more informative when it connects design to measurement. Avoid assuming that every instrument has the same temperature requirements or observes the same band.
Images, brightness curves and spectra
Imaging records spatial information
An image maps detected radiation across a field. It can reveal structures and identify targets for further work, but interpretation depends on wavelength, resolution and processing. A faint point may be scientifically valuable even when it looks unimpressive next to an illustration.
Photometry tracks how much light arrives
A brightness measurement can be repeated over time. Our exoplanet-detection guide explains how a recurring dip can indicate a transiting planet. The evidence is the pattern in the measurements, not necessarily a resolved picture of the planet.
Spectroscopy separates the light by wavelength
The ESA/Webb transmission spectrum of WASP-107 b illustrates how measurements from several instruments describe the amount of starlight blocked at different wavelengths. Such spectra provide information relevant to atmospheric interpretation. The graph is a measurement with uncertainty, not a direct inventory displayed without assumptions.
When reading a spectrum story, look for the observed feature, the proposed interpretation and any alternative explanations the authors discuss. Keep a molecular identification separate from a much broader claim about a planet’s environment or life.
From detector counts to a calibrated Webb product
A Webb image or spectrum is not transmitted from the observatory as a finished publication graphic. The Space Telescope Science Institute’s processing-stage documentation describes a traceable sequence from raw detector readings to calibrated products. Stage 0 packages the telemetry as uncalibrated exposures. Stage 1 corrects detector effects and estimates count rates. Stage 2 applies calibrations such as flat fields, coordinates and photometric information. Stage 3 combines exposures into products such as mosaicked images or extracted spectra.
This sequence matters when a story says an image was “captured.” The telescope recorded detector measurements; calibration software and reference data turned those measurements into a product that can be interpreted. Combining exposures can reject artifacts, align sky coordinates and increase the usefulness of the result, but it does not remove the need to inspect uncertainty and quality information.
The science, uncertainty and quality arrays travel together
STScI’s JWST science-data overview explains that standard products can carry a science array, an estimated-error array and data-quality information. A bright pixel in the science array therefore should not be interpreted without checking whether it is flagged or whether its uncertainty is large. Stage 1 tracks effects such as read noise and photon noise, while quality flags identify conditions such as unusable or abnormal pixels.
A practical reporting check is to record four identifiers: the observation, the product type, the pipeline version and the calibration context. These details make a result easier to reproduce and help explain why a later reprocessing can change numerical values or the appearance of a product without changing the original photons that reached the detector.
Calibration can improve after the observation
The JWST calibration-pipeline overview says the software uses instrument-specific reference files managed through the Calibration Reference Data System. Those files include items such as flat fields, bad-pixel masks and photometric calibration data. Instrument teams update them as in-flight behavior becomes better understood.
That means a paper using an older archive product and a later paper reprocessing the same exposure may not be working with identical calibrated values. Report this as a processing difference that requires evaluation, not as evidence that one team altered the raw observation. The relevant question is whether the new pipeline or reference context changes the scientific conclusion.
Why astronomical images have assigned colors
NASA’s Hubble FAQ explains that exposures are recorded in grayscale and can be combined using assigned colors associated with filters. This allows measurements in different bands to be presented in a visible image. Color processing does not, by itself, make an image scientifically meaningless.
For a concrete example, NASA’s Southern Crab Nebula color explanation identifies how individual filtered images contribute to a composite. The caption is the key to understanding what the visual represents.
Before sharing an image, check whether it is an observation, composite, simulation or artist’s impression. Use that label in your own description. You can appreciate an image’s appearance while being precise about the evidence it contains.
A worked example: reading a telescope discovery
Imagine a fictional announcement that a telescope has found a possible atmosphere around a distant planet. First identify the instrument and observing mode. Was the result obtained from a spectrum during transit, another measurement or a model fit to several datasets?
Then inspect the claim’s strength. Does the paper report a clear spectral feature, a preferred atmospheric interpretation or a tentative signal? Check whether the image attached to the news story is an illustration. It may help explain the scene without being the evidence for the atmosphere.
Finally, look for the next test. Another observation could improve precision or distinguish competing explanations. Our life-detection guide explains why an atmospheric finding should not automatically become a claim of biology.
Follow the data from observation to conclusion
Record the target, instrument, observing date and research reference. Note what was measured directly and what the team inferred. If several observatories contributed, preserve their roles rather than attributing the whole result to the best-known telescope.
Read the limitations alongside the conclusion. For a new reader, the goal is not to redo the analysis but to understand the steps that connect the data with the claim. Our scientific-evidence guide gives a broader framework for that process.
A practical way to compare observing proposals
Consider two fictional projects studying a faint object. One spends a long time on a small field; the other surveys a much larger region with less time on each position. The first may be designed for detailed measurements of selected targets, while the second searches for a population. The better proposal depends on the scientific question.
Write down four requirements: the radiation band, the detail to be distinguished, the faintness of the target and the area to be covered. Then ask which instrument and observing plan address each requirement. This prevents an attractive specification from standing in for the whole design.
Also distinguish resolving an object from detecting that it exists. A measured point can still carry useful information about brightness or a spectrum. Conversely, a detailed image does not automatically supply every physical property the reader wants to know. An inference about composition or distance may need additional observations and analysis.
When comparing published images, inspect scale bars and captions. Images displayed at the same size on a screen may cover very different angular areas. Differences in contrast settings can also affect visual impressions. Compare the measurement descriptions before drawing conclusions from how sharp or colorful the pictures appear.
Finally, identify the observing date and analysis reference. A newly published image can use data collected earlier, and a new paper can reanalyze existing observations. The contribution may lie in the measurement, the processing or the interpretation. State which one changed so readers understand why the result is news.
Common questions
Can a telescope photograph an exoplanet’s surface?
Do not infer resolved surface detail from an exoplanet discovery or a direct-detection claim. Check what the actual image resolves. A detailed globe accompanying the report may be an artist’s interpretation.
Does an older telescope become useless when a newer one launches?
Age alone does not determine scientific value. Different instruments measure different bands and properties. Compare the capability required for the question rather than arranging every observatory in one simple ranking.
How does this connect to visiting other worlds?
Telescopes supply remote measurements; spacecraft can investigate targets from closer range. Our solar-system exploration guide explains how flybys, orbiters and surface missions answer complementary questions.
Sources and method
This guide was reviewed against NASA mission explanations and the Space Telescope Science Institute’s documentation for Webb data products, processing stages, uncertainty arrays, quality flags and calibration reference files. Examples are explanatory and do not reproduce a particular research team’s analysis. Facts about software and calibration can change, so a report about a specific result should identify the product and processing versions used by that study.
Updated October 6, 2026: Added the detector-to-product data path, uncertainty and data-quality checks, and the role of pipeline and calibration-context versions.