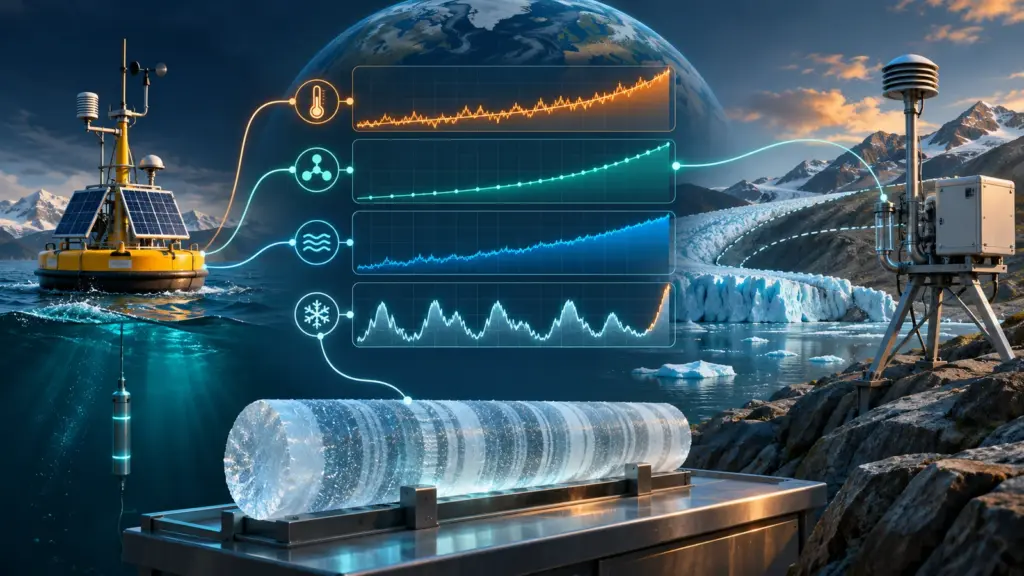
Foundation guide · Science. Climate-change evidence comes from several connected measurements: temperature, atmospheric gases, ocean heat, ice and sea level. These records answer different questions, but together they describe a warming Earth system. Understanding them means separating what has been observed, what explains the change and what future projections assume.
This guide focuses on reading the evidence rather than following a running record table. It explains the main indicators, the meaning of baselines and the difference between a long-term climate conclusion and a claim about one weather event.
What the central conclusion rests on
The IPCC’s 2023 Synthesis Report concludes that human activities, principally greenhouse-gas emissions, have caused global warming. This assessment concerns the combined evidence, not just one warm year or one thermometer. Specific estimates and regional projections can carry uncertainties while the broad attribution remains well established.
NASA’s evidence overview brings together changes in surface temperature, oceans, ice and other indicators. For a reader, convergence matters: an explanation must account for multiple observations across the Earth system, rather than explain a single chart in isolation.
Separate three questions
Ask whether a system is changing, what is causing the change and what may happen under future conditions. Those are related questions, but they require different evidence. A direct observation, an attribution analysis and a projection should be described using the appropriate terms.
For example, a measured temperature trend is an observation. Explaining the contributions of different influences is an attribution question. Estimating conditions under an emissions pathway is a projection. Keeping these labels clear prevents a debate about one question from obscuring the answer to another.
Detection, attribution, projection and impact are four stages
A more detailed evidence chain separates detection, attribution, projection and impact assessment. Detection asks whether a change is distinguishable from expected variability and measurement uncertainty. Attribution evaluates the contributions of possible causes. Projection estimates future conditions under stated assumptions. Impact assessment examines what those conditions mean for people, ecosystems or infrastructure in a particular setting.
A global attribution conclusion does not supply every local impact estimate. Likewise, uncertainty about the size of one regional impact does not erase the measurements used to detect a global change. Report the stage addressed by the source and avoid transferring its confidence level to a different question.
The greenhouse effect connects physics with observations
NASA’s explanation of climate-change causes describes how greenhouse gases affect the escape of heat from Earth. Sunlight supplies energy, while Earth emits infrared radiation. Changing the atmosphere’s interaction with that outgoing radiation changes the energy balance. The greenhouse effect is a physical process; the recent increase in greenhouse gases strengthens it.
It is useful to distinguish an influence that initiates a change from a response that amplifies or reduces it. For example, NASA discusses water vapor as a feedback that increases as the atmosphere warms. A report should identify the role being claimed rather than treating all climate influences as interchangeable.
For a simple accounting analogy, imagine a storage tank with water entering and leaving. A persistent imbalance changes the amount stored even when both flows are much larger than their difference. The analogy does not model the climate, but it helps explain why an imbalance in large energy flows can matter.
The scientific task is to measure and explain that balance, not merely to notice that several influences exist. When a story proposes a cause, ask how large its effect is, over which period and whether the predicted pattern matches observations. A list of possible influences is not an attribution calculation.
Keep mechanisms and records connected in your notes. Temperature observations describe change; gas measurements track atmospheric composition; physical understanding helps relate the observations. That structure makes a climate explanation stronger than treating a single trend line as the entire argument.
Temperature records describe change relative to a baseline
NOAA’s global-temperature explanation discusses changes across land and ocean records. Many climate charts show anomalies: differences from an average over a specified reference period. An anomaly is not an absolute temperature and is not meaningful without its baseline.
Imagine two fictional charts using different reference periods. A value of plus one degree on one is not automatically warmer than plus 0.8 degrees on the other. First put them on a comparable basis. Also check whether the chart represents the globe, one country or one station.
Weather varies within a changing climate
A cold week in one location cannot, by itself, describe the global long-term trend. Conversely, one unusually hot day does not independently establish the cause of warming. Match the scale of the evidence to the claim: local or global, daily or multi-decadal.
When you encounter a dramatic endpoint comparison, inspect the longer series. Ask whether the selected start and end dates represent the question fairly. A chart is more informative when its time span and purpose are explicit.
Why a historical dataset can be revised
NOAA’s NOAAGlobalTemp documentation identifies the dataset version and links its land, ocean and uncertainty methods. New versions can incorporate additional station records, improved ocean data, corrected metadata and refined treatment of historical observing changes.
A revision does not mean the original thermometer readings were replaced with model output. It means the process that combines uneven measurements into a global estimate was updated and documented. Compare the version, input coverage, method and uncertainty range. Then ask whether the revision materially changes the long-term conclusion rather than treating any numerical adjustment as evidence against the record.
Atmospheric carbon dioxide is measured directly
NOAA’s atmospheric carbon-dioxide record distinguishes monthly observations, seasonal adjustment and preliminary data. Its documentation also notes that Mauna Loa measurements are not identical to a globally averaged surface concentration. The measurement location and processing method are part of the evidence.
Carbon-dioxide concentration is commonly reported in parts per million. It describes the fraction of molecules in the sampled dry air, not an annual emissions total. Emissions and atmospheric concentration are connected, but they are different quantities.
For a reading exercise, place three labels beside a chart: quantity, units and coverage. “Monthly concentration at Mauna Loa, in parts per million” is a more precise description than “global pollution.” That precision helps when comparing records or tracking an update.
For a current claim, record the download or access date. NOAA’s greenhouse-gas data portal publishes site measurements and derived products with their own release dates and metadata. A station series, a marine-boundary-layer reference and a modeled global field are related products, not interchangeable versions of one number.
Why the ocean matters
The ocean stores a large share of the excess heat accumulating in the climate system. NOAA’s ocean-heat explanation describes its importance to the Earth’s energy balance. Surface-air temperature therefore does not represent the entire system’s heat content.
The NCEI ocean-heat climate data record provides time series at several averaging scales. When reading a result, check the depth range, geographic coverage and averaging period. Measurements of different layers or time intervals should not be treated as identical indicators.
Temperature and heat content are not synonyms
As a conceptual illustration, heating a cup of water and heating a large tank by the same temperature change require different amounts of energy. The example explains why a temperature change and a heat-content change are distinct quantities. An ocean study’s reported units tell you which one is being discussed.
For a news summary, retain those units and avoid converting a study into a more dramatic but undefined phrase. The scientific result is clearer when the reader knows what was actually measured.
Sea level integrates several processes
NASA’s explanation of sea-level monitoring describes contributions including thermal expansion and melting land ice. Sea-level change is not simply a second way to plot air temperature. It reflects connected processes operating over time.
Distinguish global mean sea level from the level experienced at a particular coast. For a local question, ask which local record or projection the article uses and what reference it adopts. A global statistic provides context, but a site-specific conclusion needs appropriate local evidence.
Also preserve the time horizon. An observed change over past decades and a projection for a future year should not be placed in the same sentence as if both had already happened.
How scientists investigate the cause
NOAA’s attribution overview explains evidence linking increased carbon dioxide to fossil fuels and the broader pattern of human-caused warming. Attribution examines the expected effects of different influences and compares them with observations.
For readers, the useful question is whether a proposed alternative explains the collection of evidence. Pointing to one natural influence does not establish that it accounts for the observed changes. Ask for a quantitative comparison and the scope of the claim.
Our scientific-evidence guide explains this logic more generally: a plausible idea becomes a stronger explanation when it survives tests against observations and alternatives.
Read projections as conditional statements
A projection asks what follows under a set of assumptions. When reporting one, include the scenario, period, location and uncertainty. Do not treat a future range as a collection of equally likely promises, or assume that a single value summarizes every scenario.
Consider a fictional local planning chart with several future pathways. Before comparing them, check whether the paths differ because of emissions assumptions, model choices or another input. Then distinguish the uncertainty within each path from differences between paths.
The same reporting discipline applies to data-center energy forecasts: scope and assumptions belong beside the number. A projection is most useful when readers understand what would make it change.
A practical climate-chart checklist
First identify the measured quantity and units. Then record the geographic area, baseline and time interval. Check whether the data are observed, estimated or projected, and whether the series is preliminary. Follow the original data link if an article provides only a cropped graphic.
Next inspect the conclusion. Does the chart support a claim about a local event, a global trend or a future risk? If the conclusion changes scale without explanation, look for the missing analysis. Preserve what the evidence establishes without stretching it.
Common questions
Can an uncertain regional projection coexist with a clear global conclusion?
Yes. Different questions have different levels and sources of uncertainty. Identify which estimate is uncertain rather than treating all climate knowledge as one undifferentiated claim.
Does one record year prove the whole case?
No single year supplies the whole case. Long records, physical understanding and multiple indicators provide the broader evidence. Annual records are useful updates within that larger context.
Where should I look first?
Start with the original dataset or assessment, then read its definitions. Use our science-news guide to keep the source, finding and limitations together when sharing a story.
Sources and method
This guide was checked against NASA climate evidence and cause explanations, NOAA greenhouse-gas measurements, NOAA/NCEI temperature and ocean records, and the IPCC synthesis assessment. Current figures should be cited with their dataset version, coverage and access date. The detection-attribution-projection-impact chain is used to keep measurements, explanations, scenarios and consequences from being treated as one claim.
Updated October 6, 2026: Added dataset-version guidance, explained why documented record revisions occur, distinguished four evidence stages and added dates and metadata as required context for changing values.