Space · Evidence guide. An asteroid’s reported impact probability can rise after new observations even when scientists are learning more. The number measures how much of the current range of possible orbits leads to an impact. As that uncertainty region narrows, Earth can temporarily occupy a larger share of it before later measurements move the allowed paths away from Earth.
This guide explains how NASA’s Center for Near-Earth Object Studies (CNEOS) calculates and updates impact risk. It gives readers a checklist for interpreting changing percentages without turning an evolving orbit solution into either panic or false reassurance.
Observations constrain an orbit; they do not reveal it perfectly
Telescopes measure an object’s position against the sky at recorded times. CNEOS explains in its Sentry frequently asked questions that an orbit is adjusted until its predicted positions fit those observations. More observations over a longer time span usually constrain the orbit more tightly.
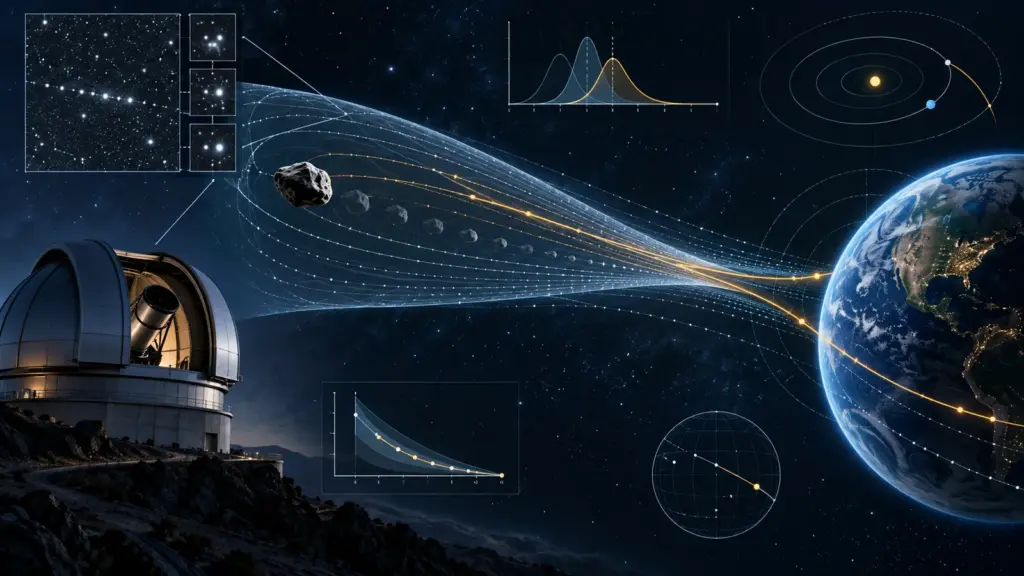
The best-fitting path is called the nominal solution. It is not the only path consistent with finite measurement accuracy. Nearby solutions form an uncertainty region, and the true orbit is expected to lie somewhere within it. A newly discovered object observed for only days can therefore have a broad range of future positions.
Sentry searches possible future paths
NASA JPL’s Sentry introduction describes an automated system that receives observations and orbit solutions, recalculates an object’s path when new data arrive and searches at least a century ahead for possible impacts.
For nonlinear long-term cases, Sentry represents the uncertainty with many possible trajectories, sometimes described as virtual asteroids. Each fits the observations to an acceptable degree but evolves differently as gravitational encounters amplify small differences. Sentry-II uses specialized sampling and orbit-fitting methods to identify trajectories compatible with both the observations and an Earth impact.
An object appears on the risk list when at least some allowed trajectories can hit Earth. That listing does not mean the nominal orbit is aimed at Earth, and it does not mean an impact is the most likely outcome.
Why the probability can rise before it falls
Picture a long uncertainty strip crossing a small circle that represents Earth. Early observations allow many possible positions, and only a small fraction cross the circle. New observations shorten the strip. If Earth remains inside it, the Earth-crossing portion can become a larger fraction, so the reported probability rises.
Further observations can then shift or narrow the strip until it misses Earth. The probability may fall abruptly to zero and the object can be removed from the risk table. CNEOS says this is the most likely outcome for newly listed near-Earth asteroids.
A rising probability can therefore mean “the remaining possibilities are concentrating near this encounter,” not “the asteroid physically changed course toward Earth.” The observations changed the estimate of an already existing orbit.
A worked probability example
Suppose an illustrative calculation represents 100,000 observation-compatible paths and 50 intersect Earth on a particular date. A simple count would be 50 divided by 100,000, or 0.05%—one path in 2,000. If later observations leave 10,000 plausible paths and 50 still intersect Earth, the simple fraction becomes 0.5%, even though the number of impact paths in this illustration did not increase.
Real Sentry calculations do not merely count equally likely paths; the system uses weighted sampling and orbit-determination techniques. The example shows only why narrowing uncertainty can increase a fraction. Use the official probability rather than recreating it from a diagram.
Historical cases show why observation history matters
In December 2004, archival observations extended the measured arc of the asteroid then called 2004 MN4. CNEOS reported that the improved orbit ruled out an impact in 2029. The object is now known as Apophis. The important evidence was not a reassuring statement alone; it was the longer observation history and the resulting reduction in the allowed future positions.
In a different long-range case, CNEOS reported in 2022 that updated data and modeling changed the 2880 assessment for asteroid 1950 DA from about one in 8,000 to about one in 30,000. That revision incorporated a longer observation arc, updated treatment of astrometric data and a newer planetary ephemeris.
These examples show why an old probability should always carry its calculation date. Risk values are outputs of the observations and model available at that time.
Different observations reduce different uncertainties
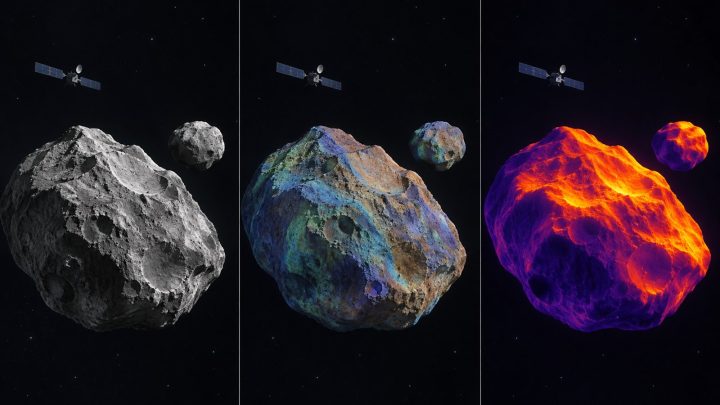
New optical positions extend the timeline used to fit the orbit. A pre-discovery image can be especially valuable because it moves the first measured position backward by months or years. Radar observations made during a sufficiently close approach can constrain distance and motion differently from sky-position measurements. Physical observations can improve estimates of size, rotation and reflectivity.
More data do not all have equal weight. Their timing, precision and geometry determine how much they shrink the future uncertainty region. A report should therefore say what kind of observation changed the result instead of attributing every revision simply to “more powerful calculations.”
Why monitoring systems can publish slightly different numbers
CNEOS notes that independent impact-monitoring systems can use different weighting, sampling and computational approaches. Small differences do not necessarily indicate a contradiction. Compare calculation times, input observations, assumed physical effects and whether the figures refer to one encounter or cumulative risk.
A responsible update names the system behind the quoted number and avoids averaging probabilities from different systems. If the values differ materially, report the methodological reason when it is available and wait for technical clarification rather than selecting the most dramatic figure.
Probability, size and hazard are different quantities
The Sentry risk table separates impact probability from estimated diameter, encounter speed and hazard scales. A small object with a comparatively larger impact probability can represent a different hazard from a much larger object with a tiny probability.
- Impact probability estimates the chance that the trajectory intersects Earth for a specified encounter or collection of encounters.
- Estimated diameter can be uncertain because brightness must be translated into size using assumptions about reflectivity unless better measurements exist.
- Torino Scale communicates public-facing hazard categories for potential impacts within 100 years using probability and energy.
- Palermo Scale compares technical risk with the expected background risk from objects of similar or greater energy over the time remaining.
Do not turn a cumulative probability across several possible dates into the probability for one particular year. CNEOS has corrected news coverage for making that mistake.
Confirmed, inferred and unknown
Confirmed: observatories recorded positions at specified times, and the published orbit solution fits those measurements within their uncertainties.
Inferred: numerical propagation produces a nominal future path and a distribution of other observation-compatible paths. The impact probability summarizes the relevant part of that modeled distribution.
Unknown: the exact future position is not perfectly known. Physical effects such as thermal forces can matter for very long predictions, and an object’s size may remain approximate when reflectivity is poorly constrained.
A checklist for an asteroid-risk headline
- Give the object’s designation and the date of the calculation.
- Name the possible encounter date rather than implying an immediate threat.
- State both the probability and its complement when useful: a 1% impact probability is also a 99% non-impact probability under the current model.
- Identify the observation arc and whether new optical, archival or radar measurements prompted the update.
- Keep probability separate from estimated size and consequence.
- Link the current CNEOS record and explain that it will change when new observations arrive.
Sources and method
Future & Fact used NASA JPL CNEOS documentation for Sentry’s orbit fitting, uncertainty regions, virtual trajectories, risk-table fields and historical updates. The numerical example is deliberately simplified and is not an independent impact calculation. Current probabilities must be checked in the live CNEOS system.
Published October 6, 2026. Related reading: how telescopes turn light into measurements and how planetary missions gather evidence.