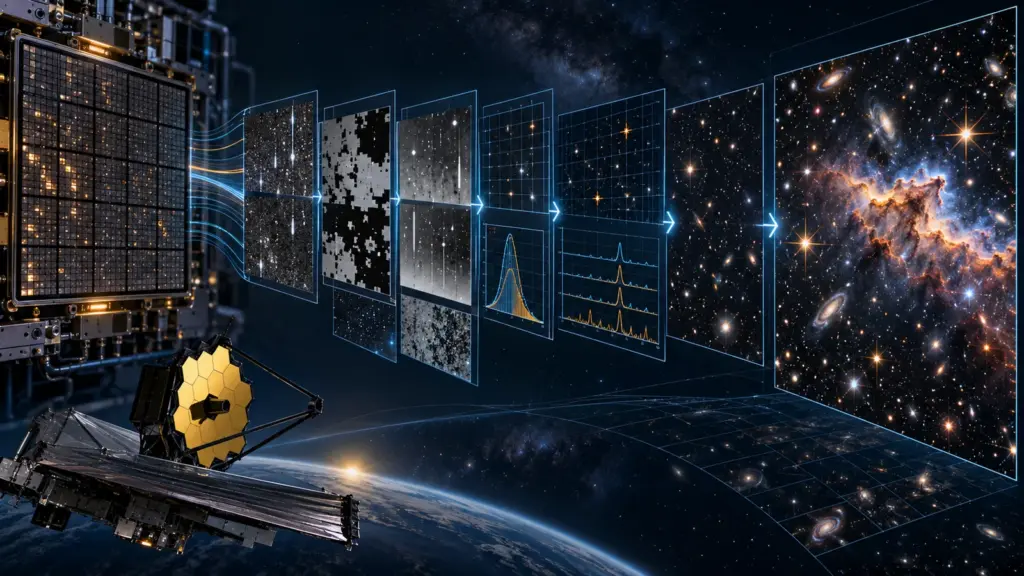
Space · Evidence guide. A James Webb Space Telescope image begins as detector readings, not as the polished color picture released to the public. Calibration software corrects instrument effects, attaches coordinates and physical units, tracks uncertainty and quality flags, and can combine several exposures. Scientists then analyze those products; image specialists may map selected filters into visible colors for communication.
This guide gives readers a repeatable way to trace a Webb result from raw counts to a scientific claim. The task is simple: identify what the detector measured, what the pipeline changed, what the researchers measured in the calibrated product and what remains an interpretation.
The four processing stages answer different questions
The Space Telescope Science Institute (STScI), which operates Webb’s science program with NASA, describes four stages of JWST data processing. File names vary by observing mode, but the stages provide a useful map.
- Stage 0 — packaged detector data: Telemetry becomes uncalibrated exposure files, commonly ending in
uncal.fits. The values represent accumulated detector signal in digital numbers. - Stage 1 — detector corrections and count rates: The pipeline treats effects such as dark current, nonlinearity, cosmic-ray jumps and bad pixels, then fits the detector ramps. A typical output ends in
rate.fitsand reports a rate rather than accumulated counts. - Stage 2 — calibrated individual exposures: Imaging and spectroscopy follow mode-specific paths. Flat-field, coordinate and photometric calibrations turn an exposure into a product such as
cal.fits, often with sky coordinates and radiometric units. - Stage 3 — combined products: Related exposures can be aligned and combined. Outputs can include resampled images, three-dimensional spectral cubes or extracted one-dimensional spectra.
“Processed” is therefore too vague for careful reporting. A Stage 1 count-rate image and a Stage 3 mosaic answer different questions and have passed through different operations. Name the product whenever the distinction matters.
What calibration corrects—and what it cannot decide
Detectors add signatures of their own. Pixels can respond differently; electronic behavior can be nonlinear; energetic particles can cause jumps; optical distortion changes how detector positions map to the sky. The Stage 1 detector documentation lists corrections and flags used before a stable count rate can be estimated.
Calibration is measurement work, not decoration. It estimates and removes known instrumental effects under documented assumptions. It does not determine whether a faint structure is a galaxy, whether a spectral feature identifies a molecule or whether a model is the best explanation. Those are later analytical and scientific judgments.
Read the science, error and data-quality information together
STScI’s science-data overview explains that Webb products commonly contain a science array, an error array and data-quality information. The science array holds the calibrated measurement. The error array estimates uncertainty. Quality flags identify conditions that can make individual values unreliable or unusable.
A bright point in the science array is not automatically a discovery. Check whether it is marked by a quality flag, whether its uncertainty is large and whether it appears in independent exposures. A cosmic-ray effect, detector artifact or processing edge can look striking in isolation.
A worked document check: a bright patch in a Webb mosaic
Imagine a news release showing a bright patch in a combined infrared image. Start with the observation identifier and filters. Then find the product type: a Stage 3 image indicates multiple exposures have been aligned and resampled. Record the pipeline version and calibration context if the paper supplies them.
Next, separate four layers:
- Confirmed: the calibrated mosaic contains increased signal at specified coordinates and wavelengths.
- Quality check: the region is not rejected by relevant flags and is consistent across contributing exposures.
- Inferred: the authors interpret the feature as a particular astronomical structure using comparison data or a model.
- Unknown: another observation may still be needed to distinguish competing physical explanations.
If a later reprocessing changes the patch’s brightness slightly, compare pipeline and reference-file versions before treating the difference as a scientific reversal. The original detector readings can stay the same while improved calibration changes the derived value.
Reference files are part of the measurement chain
The JWST calibration-pipeline overview describes instrument-specific reference files managed through the Calibration Reference Data System. They include flat fields, bad-pixel masks, photometric calibrations and parameters that configure processing steps.
Instrument teams update reference information as they learn more from in-flight data. A reproducible report should therefore identify both the pipeline software version and the calibration context where available. “Webb data” alone does not specify the processing recipe.
A scientific image is not the same as a color release image
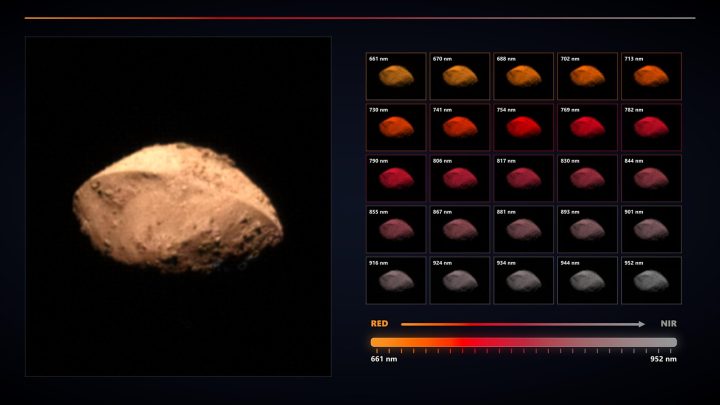
Infrared measurements are outside ordinary human vision. A public image can assign visible colors to filters, adjust contrast and combine products to show scientifically useful structure. Those decisions can make relationships easier to see, but the colors should be explained in the caption.
Ask whether the displayed picture is a single-filter product, a multiband composite, a visualization of a spectrum, a simulation or an artist’s impression. Our space-telescope foundation guide explains how wavelength, imaging and spectroscopy answer different questions.
How to verify a Webb result in five minutes
- Open the paper, observing-program page or archive record rather than relying on the release image alone.
- Record the instrument, observing mode, filters or spectral range, and observation identifiers.
- Identify whether the analysis uses Stage 2 exposures, a Stage 3 combined product or a custom reprocessing.
- Look for uncertainty treatment, quality flags and tests across exposures.
- Separate the measured feature from the model or physical interpretation attached to it.
The Mikulski Archive for Space Telescopes preserves Webb products and associated metadata. Archive access makes it possible for other researchers to reanalyze public observations, but reproducing a paper still requires its choices about extraction, filtering, background treatment and models.
Spectra add another layer of extraction
A spectrum is not always delivered as one ready-to-plot line. Depending on the instrument and observing mode, a calibrated detector product can contain spatial and wavelength information together. The analysis may define an aperture, subtract background signal, combine integrations and extract a one-dimensional spectrum. For a transit observation, the team may also compare measurements over time and model the star, planet and instrument systematics.
This is why two papers can start with the same public observation and reach different estimates without either changing the archive. They may use different apertures, background regions, noise models or physical models. A fair comparison identifies the shared calibrated inputs and then locates the analytical choice responsible for the difference.
The archive preserves data, not every scientific judgment
Public access supports checking and reuse, but an archive record does not automatically reproduce a published conclusion. Custom code, excluded integrations, model priors and quality thresholds can affect the result. Look for a methods section, code repository or supplementary material that records those decisions.
For news coverage, link the archive or observing program when it helps readers identify the evidence, then link the paper for the analysis. This keeps the observation, calibrated product and scientific interpretation connected without treating them as interchangeable.
Common reporting errors
“Webb photographed the molecule”
A molecular claim usually comes from a spectral feature and an analysis model, not a resolved picture of the molecule. Name the spectrum and the strength of the identification.
“The colors are fake, so the result is fake”
Assigned color is a visual encoding. Evaluate whether the mapping and processing are documented and whether the scientific claim rests on the underlying measurements.
“A new processing version changed the raw data”
Recalibration can change a derived product without altering the recorded exposure. Compare versions, reference files and the magnitude of the change.
Sources and method
Future & Fact reviewed STScI’s official JWST processing-stage, detector-correction, science-product and calibration-reference documentation. The worked example is illustrative and does not describe a particular discovery. Current software and reference contexts can change; check the documentation and research paper associated with the observation.
Published October 6, 2026. Related reading: how to assess life-detection claims and how scientific evidence develops.