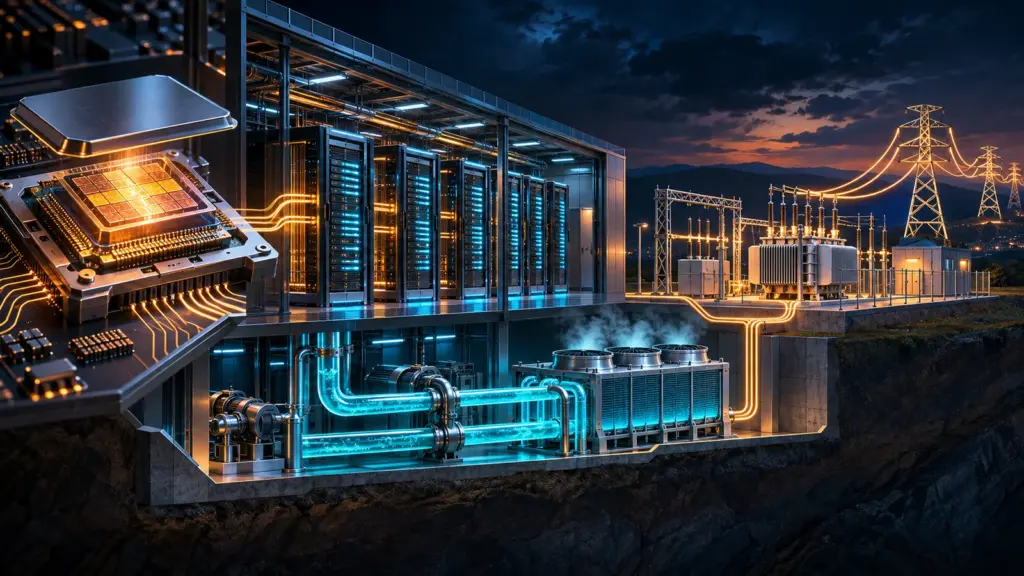
Foundation guide · AI. AI infrastructure is the chain of computing equipment, networks, buildings and utility service that allows a model to be trained or used. A processor announcement describes one component. A campus rendering describes an intention. Neither proves how much useful computing is operating, how much electricity it draws or when the full system can enter service.
This guide follows an AI workload from processors to the electric grid and shows how to check the claims made at each layer. The numerical examples are transparent, hypothetical calculations rather than estimates for a named facility. Current project claims should be checked against dated company disclosures, utility records and government permits.
Training and inference create different workloads
Training adjusts a model’s parameters; inference uses a trained model to produce outputs. The two can place different demands on hardware and operations. MLCommons’ benchmark overview separates training and inference evaluation, reflecting the importance of describing the workload being measured.
Imagine a research organization running a large training job for several weeks and a service answering requests throughout the year. The first must coordinate a sustained computation. The second must meet demand as requests arrive. Both consume resources, but “the cost of AI” is incomplete unless it identifies the workload and the period.
Training and inference also need different evidence. A training result may report the time and system needed to reach a defined model-quality target. An inference result may report latency, throughput and accuracy under a stated request pattern. A comparison is meaningful only when the task, quality threshold, system boundary and operating conditions are visible.
Read our language-model guide to connect these stages to the model itself. An inference service can also include retrieval, tool use and other software whose resources belong in a complete account.
Processors are one part of the computer
Compute, memory and movement of data
A useful way to read hardware claims is to separate arithmetic capacity, the amount of information that can be held nearby, and the speed of moving that information. In a multi-device system, communication among devices matters as well. A headline processor specification cannot substitute for a workload measurement.
MLPerf’s datacenter inference documentation provides a route to results tied to defined systems and workloads. When comparing announcements, check whether the numbers describe a chip, a server, a cluster or a service. Those are different boundaries.
A bottleneck changes the value of a component
Consider a fictional editing team with many fast writers but one slow document-delivery process. Adding more writers would not necessarily increase completed work. The analogy is limited, but it illustrates why component counts do not directly translate into useful system output.
For a data center, ask what was measured end to end. If a company provides only theoretical peak performance, label it accordingly. An operational benchmark includes choices about hardware, software and the work being performed.
Power and energy are different quantities
The U.S. Energy Information Administration distinguishes watts, which measure power, from watt-hours, which measure energy over time. Megawatts and megawatt-hours therefore answer different questions: the rate of electricity use and the accumulated amount used.
For example, a hypothetical facility averaging 10 megawatts for 24 hours uses 240 megawatt-hours over that day. The multiplication assumes that average power. A 10-megawatt connection rating does not establish that the facility draws 10 megawatts continuously.
When reading a project announcement, ask whether a megawatt figure refers to contracted service, planned capacity, IT equipment or the full site’s load. Preserve the original definition. Comparing unlike figures can make two projects appear similar when their electrical boundaries differ.
Cooling and overhead belong in the accounting
Berkeley Lab’s 2024 United States Data Center Energy Usage Report estimates historical U.S. data-center electricity use and presents scenario ranges through 2028. Its scope is a reminder that processors are not the whole facility. Cooling, power conversion and supporting equipment affect the resource footprint, while a projection remains conditional on its assumptions.
Power usage effectiveness, or PUE, compares total facility energy with IT equipment energy over a defined boundary and period. If a hypothetical site uses 120 units in total while its IT equipment uses 100, the ratio is 1.2. That arithmetic says nothing by itself about the useful work completed or the carbon intensity of the electricity.
A lower overhead ratio can coexist with greater total energy use if the amount of computing expands. For an environmental claim, ask separately about efficiency per task, total workload and the electricity source. These quantities should not be collapsed into one flattering adjective.
Water claims need their own definitions
Berkeley Lab’s data-center research overview describes work on cooling, air and liquid management, and water use. For a project reader, the key is to identify which water flows the claim includes. Direct site use and water associated with electricity production are different accounting boundaries.
Suppose two fictional facilities report annual water totals. Before comparing them, ask whether both measure consumption or withdrawal, whether the totals cover the same period, and whether the work performed is comparable. Also inspect the local context: a global average cannot explain the conditions of a particular water system.
Do not infer a site’s design solely from the phrase “liquid cooling.” Ask for the described heat-removal system and its operating assumptions. Where a detail is absent, report the gap rather than guessing a water requirement from a technology label.
Grid access is a project milestone
The IEA’s analysis of AI-related energy demand treats electricity requirements as an infrastructure issue, not merely a chip specification. At project level, the reporting question is whether the proposed facility can receive the required service when it needs it.
Start with the utility arrangement, then look for studies, required upgrades and an energization schedule. Regional forecasts such as PJM’s load-forecast materials describe expected demand across a system; they do not prove that one named campus has completed its service process. A project’s announcement date and its expected electricity-delivery date are separate facts. Our grid-access guide follows those milestones.
A power contract also needs careful reading. Ask what it supplies, over what period and through which physical connection. Our power-supply verification guide explains why a generation announcement is not the same record as a completed utility connection.
Generator interconnection and large-load service are also different processes. FERC’s Order No. 2023 explainer concerns proposed generating facilities connecting to the transmission system. It should not be cited as proof that a data center has secured electricity service.
Read forecasts as conditional calculations
An electricity forecast depends on assumptions about deployment, utilization, efficiency and demand. The IEA report provides scenarios rather than a guarantee of a single outcome. When citing a forecast, keep the publication date, geographic scope and scenario attached to the number.
For a fictional campus, compare a design case with an operating case. The first might describe full build-out; the second might include only its initial phase. Neither necessarily represents measured consumption today. A headline should make that distinction visible.
The same logic applies to claimed efficiency gains. Ask whether the calculation holds workload constant or assumes growth. A reduction per request cannot, on its own, tell you whether annual consumption will rise or fall.
A practical project-reading worksheet
Create five fields: location, owner, phase, electrical boundary and evidence. Under phase, use the actual documented milestone rather than a vague “underway.” Under evidence, save the permit, utility record or company filing that supports the statement.
Then add a column for unknowns. A missing service date, undisclosed load definition or unconfirmed construction start is useful information for follow-up. Avoid combining records from separate phases simply because they share a project name.
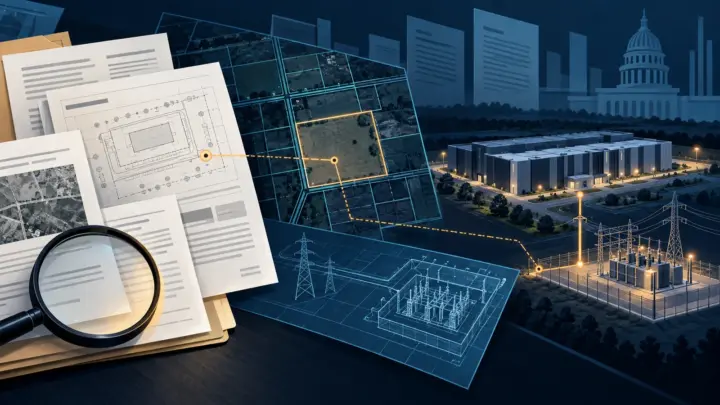
Use our county-permit guide and project-pipeline explainer to investigate those details. A portal such as Loudoun County’s LandMARC system can show applications, plans, permits and inspections, but each record proves only its own stage. The aim is a chain of records that describes what can actually be built and operated.
The evidence chain behind an infrastructure claim
No single record establishes an entire project. A company release can establish what the developer announced. A land-use decision can establish what a local authority approved. A building or air permit can establish a specific authorization. A utility or grid record can establish part of the electrical-service process. Metered operation is a later fact again.
Keep these records in chronological order and label the status supported by each one. For example, Loudoun County’s official data-center status page distinguishes existing buildings, construction, approved capacity and applications still in review. The county also cautions that not every approved or proposed project will be built. That distinction is more informative than adding every disclosed square foot into one “pipeline” total.
For a reported capacity figure, preserve the source’s noun as well as its number: IT load, total facility load, connection capacity, generation capacity and annual energy are not interchangeable. If the record does not define the boundary, mark it unknown and ask for clarification.
A worked accounting example
Suppose a fictional site’s IT equipment averages 8 megawatts over a 30-day month. The period contains 720 hours, so IT energy is 5,760 megawatt-hours. If the facility’s PUE over that same boundary and period is 1.25, total facility energy is 7,200 megawatt-hours. The example assumes that the inputs describe comparable measurements.
Now compare that result with a 20-megawatt advertised campus capacity. The capacity does not contradict the 10-megawatt average total implied by the example. It may describe a different phase, an upper limit or a different boundary. The next reporting step is to find the definition in the original announcement, not to choose whichever figure appears more dramatic.
To estimate energy per completed task, you would also need a task count and an allocation method. A shared facility may run multiple workloads. Dividing all site energy by one application’s requests could attribute unrelated consumption to that application. Conversely, counting only a processor while ignoring relevant supporting resources could omit part of the footprint.
Finally, energy is not an emissions figure. Converting it to an emissions estimate requires information about the electricity and the chosen accounting approach. State those assumptions. This chain of definitions is what allows readers to compare a site’s claim with another report without silently changing the question halfway through the calculation.
Common questions
Can a chip count tell us electricity demand?
It is insufficient on its own. You need the system configuration, operating conditions and facility boundary. Treat calculations based on incomplete specifications as estimates with stated assumptions, not measured consumption.
Does more capacity mean more useful AI?
Capacity is a resource. Useful output depends on the workload and system performance. Follow the resource claim with a task-level question: what work can the system complete, at what quality and over what period?
What belongs in an infrastructure headline?
Name the milestone and define the quantity. “Planned electrical capacity” and “measured annual consumption” convey different facts. Pair this guide with our benchmark explainer to connect the physical system with evidence about its performance.
Sources and method
This guide was checked against primary and institutional sources from the U.S. Energy Information Administration, Lawrence Berkeley National Laboratory, PJM, the Federal Energy Regulatory Commission, Loudoun County and MLCommons. Institutional reports support the definitions and system-level context; company statements and project portals must still be checked for each named development. Calculations in this guide are illustrative and show their assumptions.
Updated October 6, 2026: strengthened the distinction between training and inference evidence, replaced the Berkeley Lab source destination, added PJM and FERC process boundaries, and added a public-record evidence chain.