Europe’s Sentinel-3C satellite has returned its first thermal-infrared images, showing land and ocean temperature patterns over Western Australia, southwestern Europe and North Africa. The early data indicate that the satellite’s Sea and Land Surface Temperature Radiometer is operating before full commissioning is complete.
The European Space Agency released the Sentinel-3C thermal images on November 18. Sentinel-3C launched on September 15, 2026, as the third satellite in the Copernicus Sentinel-3 mission.
What Sentinel-3C saw over Western Australia
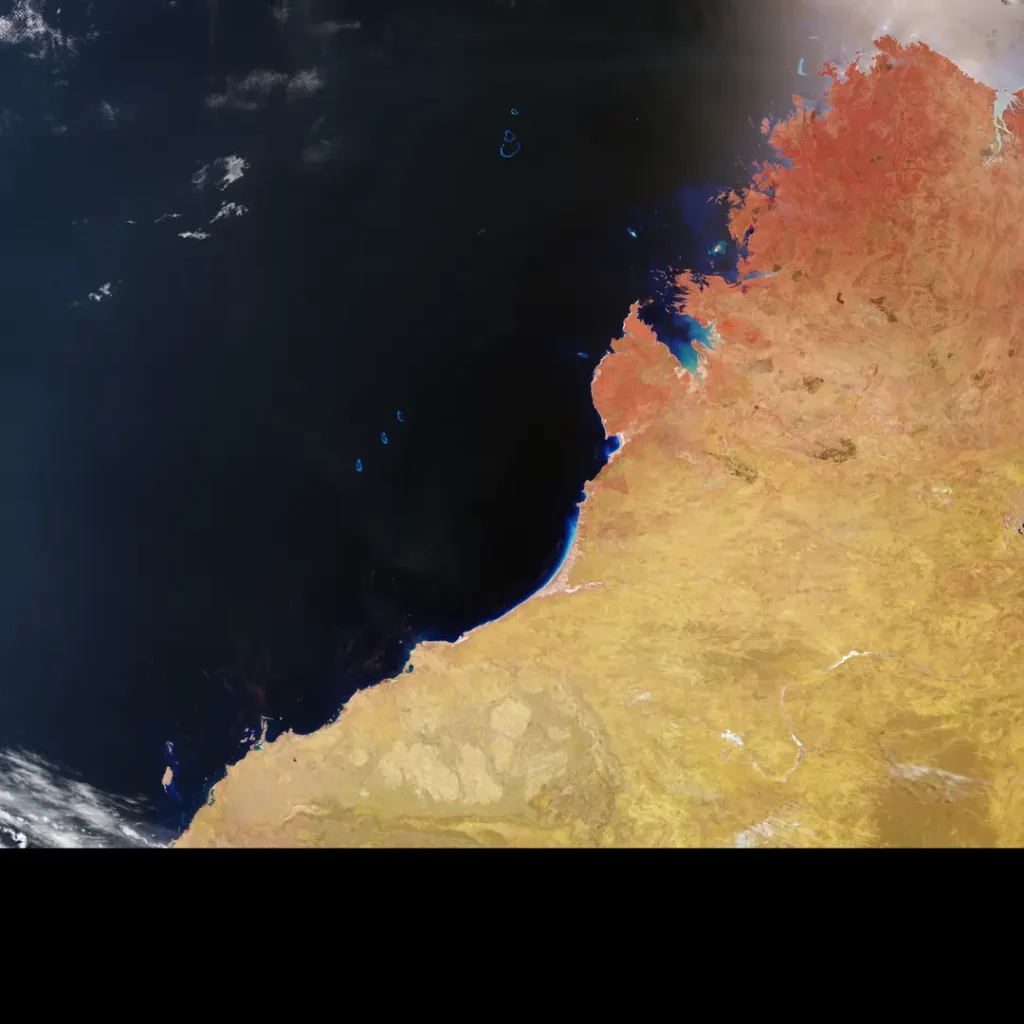
An image captured on November 4 covers the Kimberley region, including Broome, the Dampier Peninsula and the Rowley Shoals. In the thermal view, brightness temperatures over much of the lower land area exceed 40°C. Parts of the northern coast are at or below 35°C, while the eastern Indian Ocean is around 20°C.
A companion false-colour view combines visible and near-infrared measurements. Red tones indicate denser vegetation, while dark-brown areas mark scars from recent wildfires. The shallow coral atolls of the Rowley Shoals also become easier to distinguish.
The European image combines heat and vegetation information.
Sentinel-3C observed southwestern Europe and part of North Africa on November 2. The thermal channel shows southern Portugal and Andalusia in the mid-to-high 20s Celsius, with parts of Morocco and northern Algeria above 30°C.
In the false-colour image, bright green areas correspond to denser vegetation and generally cooler conditions. Shortwave-infrared data also reveal wildfire scars west of Madrid and near Bordeaux.
These are examples of what multispectral observation can do: one instrument separates reflected visible light, reflected infrared light and emitted thermal radiation to reveal different physical properties.
Brightness temperature is not a thermometer reading.
ESA describes the values as brightness temperatures measured at the top of the atmosphere. A sensor infers the temperature of an ideal emitter that would produce the observed radiation in a particular band.
That value can differ from the physical surface temperature because real land and water emit radiation differently and because the atmosphere modifies the signal. Cloud, moisture, viewing angle and surface emissivity also matter. The early images should therefore not be interpreted as direct ground-thermometer maps.
How the SLSTR instrument works
The Sea and Land Surface Temperature Radiometer has nine spectral bands spanning visible, shortwave-infrared and thermal-infrared wavelengths. Two additional channels are dedicated to detecting and measuring intense fires.
Sentinel-3 satellites repeatedly measure oceans, land, ice and atmosphere for Europe’s Copernicus services. Consistent observations from several satellites improve coverage and help maintain long records when individual spacecraft age.
Future & Fact’s explanation of climate-change evidence describes why long-term conclusions depend on calibrated records and multiple independent measurements rather than a single hot day or one satellite image.
What happens before the data become operational?
First images are an engineering milestone, not the end of validation. Teams still need to calibrate the instrument, compare it with reference measurements, characterise uncertainty and confirm consistency with Sentinel-3A and Sentinel-3B.
If commissioning proceeds as expected, Sentinel-3C will extend the mission’s ability to monitor sea-surface temperature, land heat, vegetation and fires. The images already demonstrate that its visible, shortwave-infrared and thermal channels can produce coherent views of the same landscape.